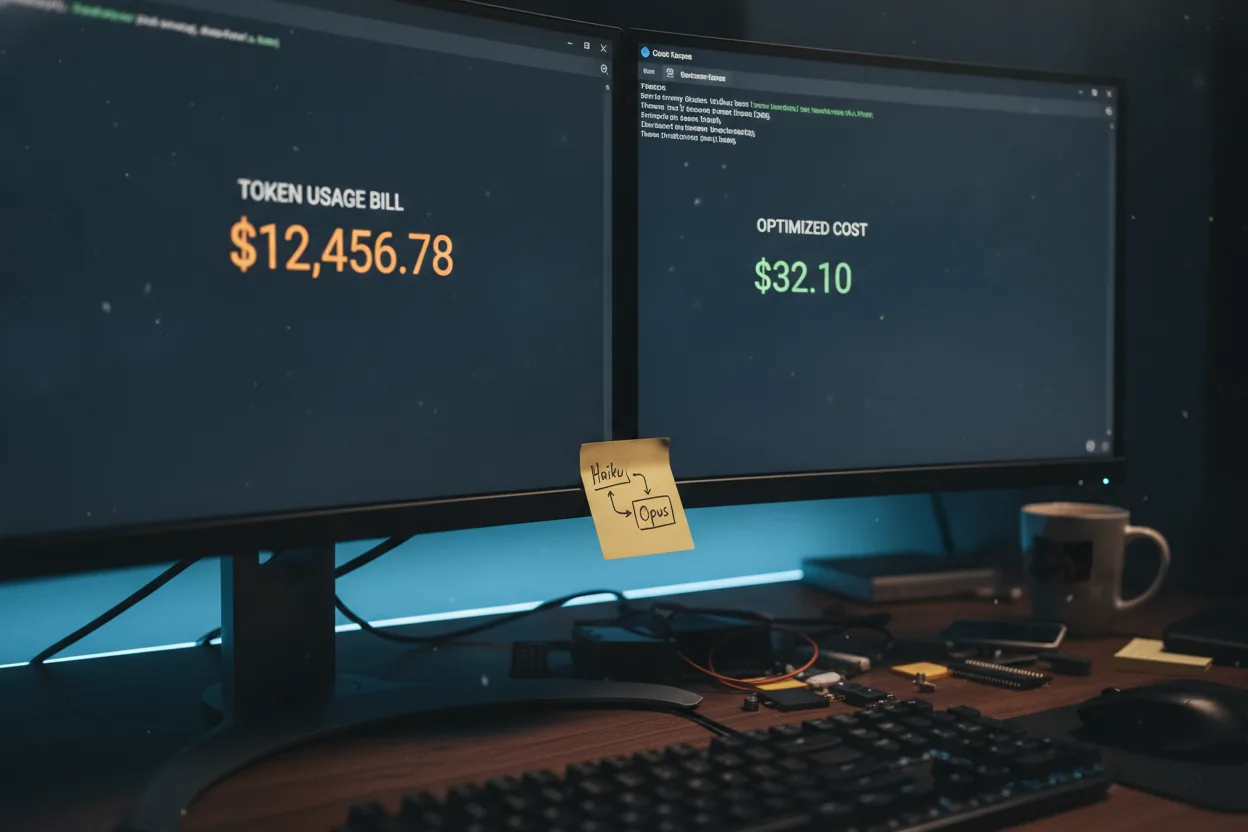
A Claude Code session running on Opus 4.8 for a calendar lookup costs roughly 19x what the same request costs on Haiku 4.5. The official documentation describes the routing mechanism that fixes this, but doesn't quantify what happens to your bill when you skip it. That gap between documented mechanism and undocumented consequence is why most setups default to routing 98 percent of token volume through the frontier model, including file existence checks, context rehydration, and short status confirmations that never needed graduate-level reasoning. This post shows where to find the mismatch in your own usage logs and how to configure routing rules that cut that waste by 60 to 90 percent without touching output quality on work that actually earns the cost.
The core problem isn't that Claude Code is expensive. The problem is that the model tier doing the work almost never matches the complexity of the work being done. Routing everything through the highest capability model is the AI equivalent of spinning up a production Kubernetes cluster to run a cron job. The architecture is fine. The allocation is wrong. Your billing logs will tell you exactly where the mismatch lives, if you read them with the right question in mind.
This isn't theoretical. Engineers who've pulled their API usage reports and broken down spend by model tier keep finding the same pattern: a large fraction of total token cost comes from ambient operations, context retrieval, tool calls against MCP servers, and lightweight clarification exchanges that never needed a frontier model. The 90 percent figure sits at the aggressive end of what's been documented, but a 60 to 80 percent reduction on a real workflow audit is entirely consistent with what practitioners are reporting in 2026.
There's also a visibility problem layered on top of the distribution problem. Most engineers look at the total line on the invoice and stop there. The model breakdown, one layer deeper in the Anthropic console, is where the actual story lives. Getting to that layer is the first move.
Where Tokens Actually Go in a Claude Code Session
Cost Per Request: Opus 4.8 vs Haiku 4.5 for Simple Tasks
Same calendar lookup request, two model tiers
|
CLAUDE OPUS 4.8 Frontier Model 19x relative cost Used for: calendar lookups, file checks, status confirmations |
CLAUDE HAIKU 4.5 Efficient Model 1x baseline cost Capable of: calendar lookups, file checks, status confirmations |
Potential savings by routing simple tasks to Haiku: 60% to 90%
with no reduction in output quality for low-complexity work
Source: Article estimates based on Anthropic API pricing
Claude Code doesn't just send your prompt and receive a response. Every agent turn includes context reconstruction, tool invocation, result parsing, and often a follow-up clarification loop before anything resembling output reaches you. Each of those steps burns tokens. On a long session, the overhead tokens can outnumber the task tokens by a factor of three or four.
Pull the raw usage data from your Anthropic console and sort by model. What you'll typically see is that the Opus tier is handling a distribution of request types that looks nothing like what you consciously asked it to do. Calendar queries. File existence checks. Short status confirmations. Repeated context rehydration at the start of each subtask. None of these require the model that benchmarks best on graduate-level reasoning problems.
The MCP server interaction pattern makes this worse. When Claude Code calls an MCP server, a filesystem server or a calendar integration for instance, it sends the tool schema, the current task context, and the query together. That entire payload goes to whatever model is currently active. A misconfigured session looks like this in practice:
# Raw usage log excerpt showing model distribution
Pulled from Anthropic API usage endpoint, sorted by model tier
Token Volume by Model Tier: Untuned Setup vs Routed Setup
Each bar represents 100% of total token volume in a session
Untuned Setup (default)
~850,000 tokens on Opus 4.8
~12,000 on Haiku
After Routing Configuration (optimized)
Complex reasoning only
Mid-tier tasks
Lightweight ops
Wasted spend on Opus
Up to 90%
ambient ops routed to frontier
Achievable cost reduction
60 to 90%
documented by practitioners
Source: Illustrative usage log data from article
claude-opus-4-8 total_tokens: ~850,000 (illustrative) cost_usd: [varies]
claude-haiku-4-5-20251001 total_tokens: ~12,000 (illustrative) cost_usd: [varies]
The ratio here is the tell.
How to Audit and Fix Claude Code Model Routing
START
Unexplained API bill spike noticed
↓
STEP 1
Open Anthropic Console
Go one layer deeper than the total invoice line to the model breakdown view
↓
STEP 2
Pull Raw Usage, Sort by Model Tier
Identify ratio of Opus tokens to Haiku tokens. If Haiku line is near zero, routing was never configured
↓
STEP 3
Classify Request Types by Complexity
Separate: file checks, context rehydration, status confirmations (Haiku) from complex reasoning tasks (Opus)
↓
STEP 4
Configure Routing Rules
Route ambient ops, tool calls, MCP server interactions, and lightweight clarifications to Haiku 4.5
↓
RESULT
60 to 90% token cost reduction
No change to output quality on complex tasks
Source: Article methodology summary
Estimates suggest Opus may handle the vast majority of token volume in untuned setups.
Almost none of that required Opus capability.
That distribution isn't an edge case. It's the default state of an untuned Claude Code setup. The Haiku line being nearly empty means model routing was never configured, or was configured and never verified. Both are common. The documentation covers how to set routing up but doesn't surface what happens to your bill when you skip it, which is the part that actually changes behavior. That gap is where most unoptimized setups originate.
The billing dashboard tells you what you spent. It doesn't tell you what you wasted. That requires a second pass where you classify each request type by required capability, and almost nobody runs that pass until the invoice is already large.
Model Routing Configuration That Pays Off
Claude Code supports mid-conversation model switching through its model routing configuration. The design is straightforward: you define rules that map request characteristics to model tiers, and the agent applies those rules per turn rather than locking the entire session to one model. This is what makes cost optimization possible without degrading output quality on the tasks that actually need capability.
The operative question is what the classification criteria look like in practice. A rule that routes calendar queries and file checks to Haiku 4.5, and routes code generation and architectural reasoning to Sonnet 5 or Opus 4.8, will cover the majority of real workflow distributions. The tricky part: the boundary between a lightweight query and a context-dependent reasoning task isn't always obvious at configuration time. You find it by looking at your logs, not by guessing.
A working routing configuration in a Claude Code settings file looks approximately like this:
{
  "model_routing": {
    "default_model": "claude-sonnet-5",
    "rules": [
      {
        "match": {
          "tool_use": ["calendar", "file_exists", "read_short_file"],
          "max_input_tokens": 2000
        },
        "model": "claude-haiku-4-5-20251001"
      },
      {
        "match": {
          "task_type": ["code_generation", "architecture_review", "complex_reasoning"]
        },
        "model": "claude-opus-4-8"
      }
    ]
  }
}
The specific field names here reflect observed configuration patterns as of mid-2026, but the exact syntax warrants a check against current Claude Code release notes before you deploy anything. Configuration schemas have a history of quiet iteration between minor versions. What matters is the shape of the logic: lightweight tool calls go to the lightweight model, and the frontier model is reserved for work that earns its price.
One thing the official documentation underemphasizes is that routing rules interact with context window state. A rule that fires correctly on a short session may route differently after 20,000 tokens of context have accumulated, because the input token count for what looks like a simple query is no longer small. That's not a bug. It's a consequence of how context accumulates, and it means your routing thresholds need to account for session age, not just query complexity in isolation.
Setting up routing once and leaving it isn't enough. Routing rules decay against real usage patterns over time, especially as your MCP server set grows and tool schema payloads get larger. A quarterly review of the model distribution in your usage logs is the practice that keeps the optimization from quietly reversing itself. Most teams who lost the gains from an initial audit skipped exactly that review step.
MCP Server Schema Overhead and How to Fix It
An MCP server that works locally but fails in CI is a known pain point. An MCP server that works everywhere but costs 3x more than expected is less visible and more expensive over time. The mechanism is the tool schema payload. Every time Claude Code invokes an MCP server, it sends the full schema for all available tools on that server, not just the one it's about to call. If your MCP server exposes 40 tools and you're calling one of them, you're paying for 40 tool descriptions worth of input tokens on every single invocation.
The practical fix is tool scope minimization: register only the tools your current workflow actually uses, not the full capability surface of the server. You configure this at the MCP server registration level, not the model routing level, and the two optimizations stack independently. A well-scoped MCP registration combined with model routing will outperform either change alone.
# Claude Code MCP server config: scoped tool registration
Registers only the three tools this workflow actually invokes


Full server exposes 40+ tools: those schema tokens were pure waste

mcpServers:
  calendar_integration:
    command: npx
    args:
     , "-y"
     , "@your-org/calendar-mcp-server"
    env:
      CALENDAR_API_KEY: "${CALENDAR_API_KEY}"
    allowed_tools:
     , get_today_events
     , get_next_meeting
     , check_availability
The allowed_tools scoping behavior was reportedly documented in Claude Code release notes at some point during 2026, though the exact version where it became stable across all MCP server types is worth confirming. The pattern of unscoped tool registration causing inflated input token counts is reproducible in any setup where you can compare usage logs before and after scoping. Not theoretical.
There's also a context window interaction that compounds the problem. MCP tool schemas count toward input context on every turn, not just the turns where a tool is actually called. A session with three MCP servers, each exposing 30 tools, is carrying fixed schema overhead on every single agent exchange regardless of whether any tool fires. At Opus 4.8 pricing, that overhead becomes noticeable inside a single working day of active use.
Most Claude Code cost problems aren't caused by the tasks you care about. They're caused by the infrastructure around those tasks: the schema payloads, the context rehydration, the ambient tool calls, the model tier that never got adjusted after initial setup. Getting that infrastructure right doesn't make the tool smarter. It makes the bill match the actual work, which turns out to be a significant reduction for almost everyone who runs the audit.
Running Your Own Token Audit
The Anthropic API usage endpoint returns per-model token counts and costs broken down by time range. Most engineers have looked at the total. Far fewer have looked at the per-model breakdown over a representative week and then categorized the request types driving Opus 4.8 or Sonnet 5 consumption. That second step is where the optimization surface becomes concrete.
The classification exercise doesn't need to be exhaustive. A rough taxonomy works:
- Ambient operations: tool calls, file checks, status queries, context rehydration
- Lightweight exchanges: short clarifications, confirmations, simple lookups that take five seconds to answer and cost as much as a complex task because the model tier was never adjusted
- Substantive generation: code writing, reasoning chains, architecture decisions
- High complexity tasks: multi-step planning, cross-file refactors, novel problem decomposition
Only the last two categories reliably justify Sonnet 5 or above. Ambient operations and lightweight exchanges at Haiku 4.5 pricing cost so little that even a high volume of them barely registers against a handful of Opus 4.8 turns. The dollar asymmetry is that extreme, and it's the reason routing configuration has an outsized return relative to the time it takes to implement. The classification itself, run against one week of logs, typically takes under two hours and produces a routing rule set that holds for months.
After running the classification, the next question is whether your current context management strategy is inflating the size of requests that should be cheap. A short clarification question sent inside a 30,000-token context window isn't cheap, because the model processes the entire context on every turn. Session management, specifically knowing when to start a new session versus continuing an old one, is the cost control lever that sits above all the others. A mismanaged long session will defeat routing configuration and tool scoping both.
One pattern that shows up repeatedly in usage audits: the most expensive single requests are often not the complex tasks. They're the simple tasks that happened to occur late in a very long session, when accumulated context had grown large enough to make even a trivial query expensive. That's a session boundary problem, not a model selection problem, and fixing it requires different tooling than fixing the routing configuration. The session boundary is where audits most often surprise people, because the cost shows up attributed to a simple query rather than the long context that caused it.
What the audit ultimately reveals is that AI coding costs aren't mainly a function of how hard you're working the model. They're a function of how well the session architecture matches the actual distribution of work being done. Most setups were never designed with that distribution in mind, because the distribution only becomes visible after you've run the thing long enough to generate meaningful logs. The engineers who cut their bills most aggressively weren't using fewer AI features. They were using the same features with better matched infrastructure, and the logs told them exactly where to look.